
The Mesh Rider Real Timer Radio Monitor is a cross-platform application that allow users to monitor the link state of the connected radio. This tool is a real time graphing equivalent of the link status logs. The tool supports Windows(x86_64,ARM), macOS (ARM) and Ubuntu (x86_64).
Download and Installation
Visit this page to get the latest version of the graphing utility for your operating system. Please note you will have to create a user account to access this software:
-
- Windows: Download the
.exefile and run it directly - Linux: Download either the standalone executable or the
.debpackage - macOS: Download the
.dmgfile, open it, and drag the application to your Applications folder - Usage
- Windows: Download the
1. Connect to the radio you wish to monitor. Currently the tool only lets you connect to one radio at a time. It should also be possible to run multiple instances of the same application to connect to more radios. For a range test between a drone and a GCS, it would be advised to start an instance of this application for each radio to monitor the link from both sides.

- IP Address: Enter the target radio you wish to connect to.
- Username: Enter the SSH username for the device. Mostly likely to be root if using the default radio settings.
- Password: Enter the SSH password. Most likely to be passwordless if using the default radio settings; which in this case you would leave the field empty.
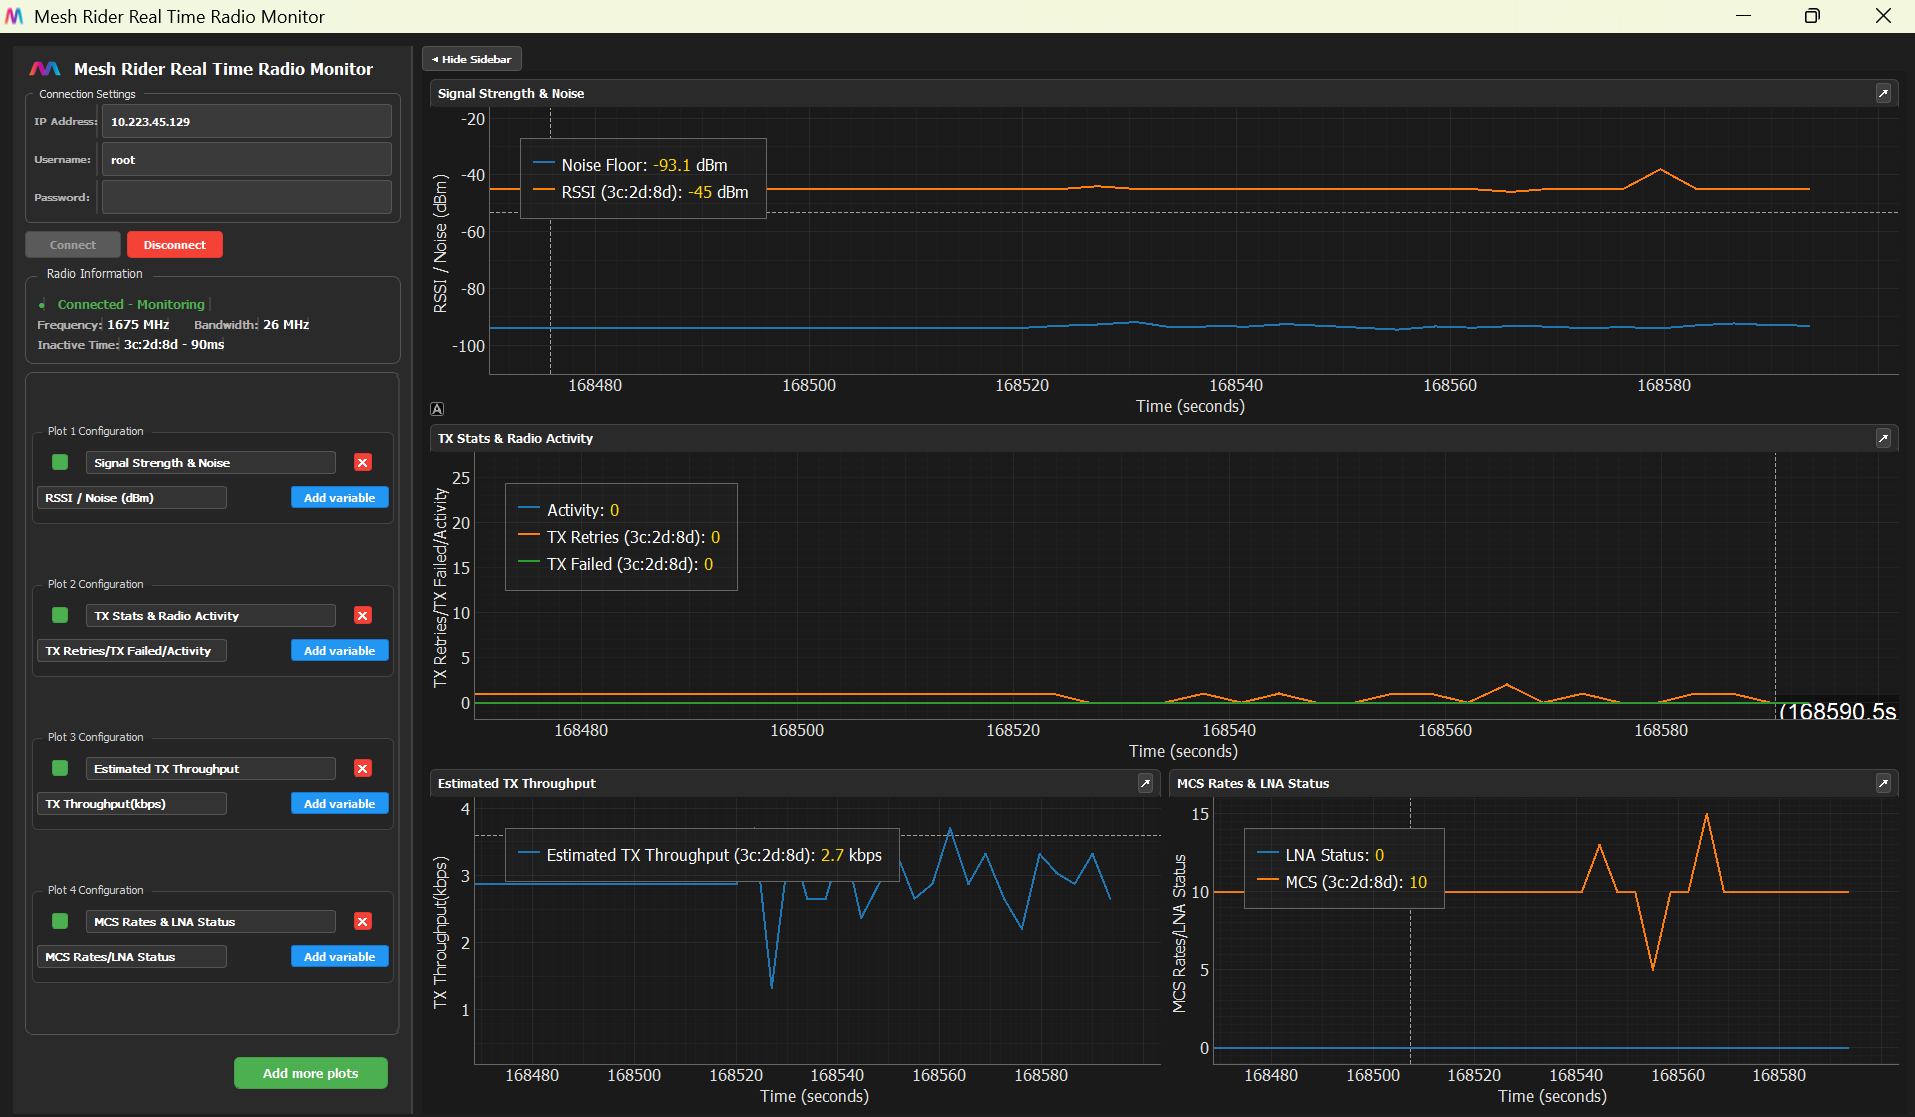
2. The application starts with default plots with most useful metric in range testing with Mesh Rider radios.

The default plots show the RSSI, Noise, Activity, TX Retries, TX Failed, Estimated TX throughput, MCS Rates and LNA Status.
3. There is also a section that shows additional radio information. Please keep a look at the inactive time of the connected stations as it may take a while for the logs to disconnect mesh nodes which are no longer connected.

4. You can configure the tool to plot other link state variables using the "Add variable", "Add more plots" buttons.

Here is currently the selection of items that can plotted. 
Common Issues and Solutions
1. Connection Failures- • Verify the IP address is correct
- • Ensure the device is online and accessible
- • Check that SSH is enabled on the device
- • Verify firewall settings aren't blocking connections